Start with a question
Describe what you want to understand. SID builds a view using the school data you are permitted to access.


Turn a question about your school’s data into a dashboard you can keep exploring. SID helps build charts, tables and headline figures, then refines them with you.
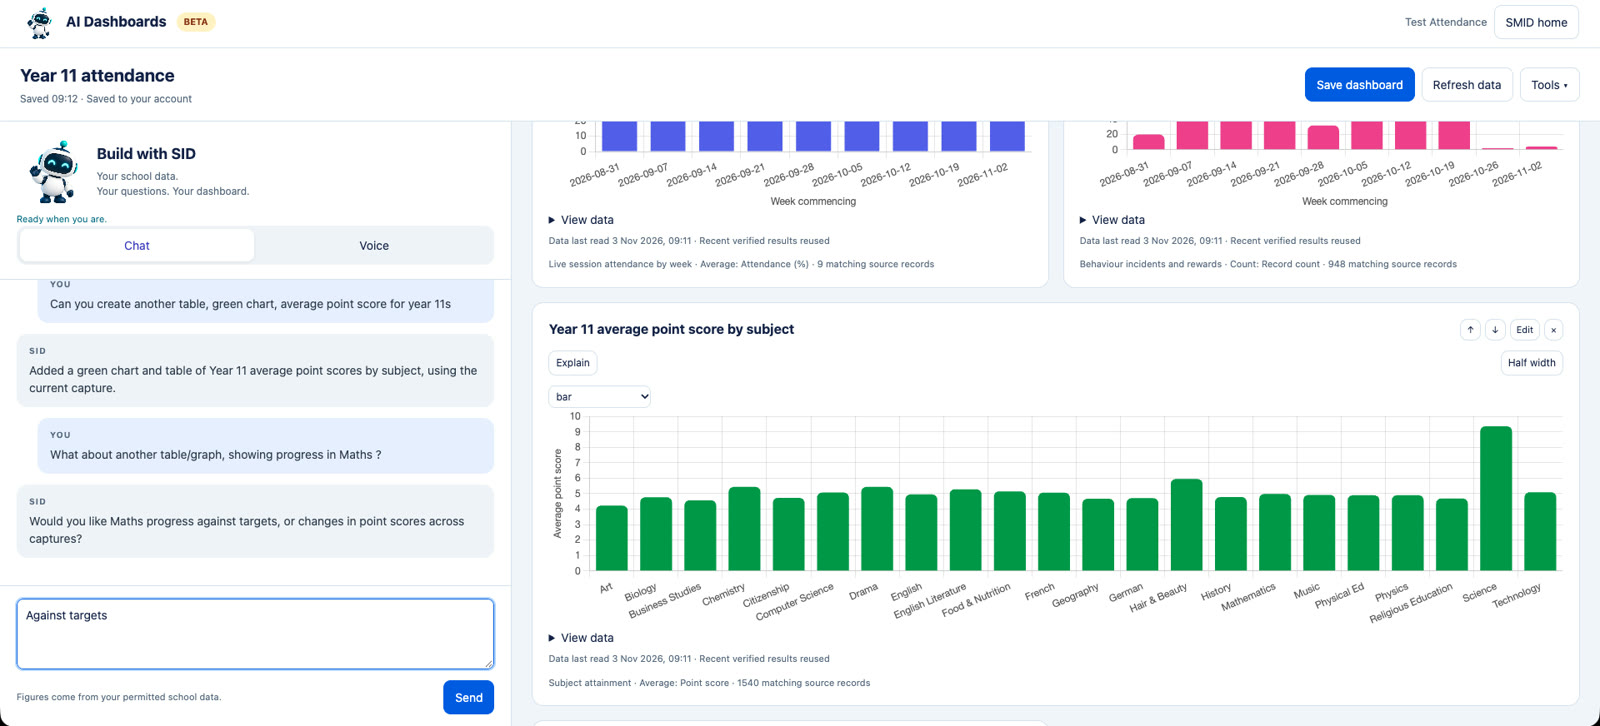
Describe what you want to understand. SID builds a view using the school data you are permitted to access.
Ask follow-up questions through chat or voice. Change charts, captures and filters as your ideas develop.
Save dashboards to return to later. Download a PDF or export the data as CSV when you are ready to share your findings.
AI Dashboards is in beta. Check captures, filters and figures before using or sharing findings.